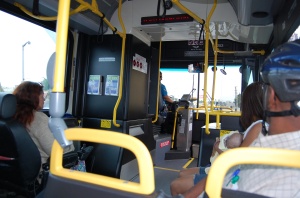
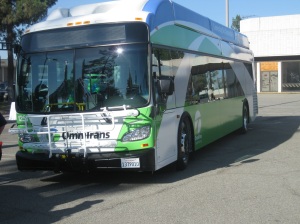
San Bernardino, CA–People climbed aboard Omnitrans buses in record numbers during October, with over 1.5 million trips tallied. Along with surpassing the previous top ridership month mark set in October 2001, the transit agency also set a new high for a single day on October 3 with over 68,000 boardings.The month began strong, boosted by promotional efforts tied to Southern California “Rideshare Week” (October 1 -5) which happened to coincide with spiking gasoline prices in California. Boardings jumped 17.5 percent in that first week compared to 2011. In the end October 2012 finished 9.4 percent ahead of last year.
“We offered a free ride coupon online for Rideshare Week, the same as we have done since 2009,” said Director of Marketing Wendy Williams. “But this year coupon redemption nearly tripled.”
 Even after gasoline prices eased and the free ride promotion ended, passenger boardings have remained brisk. Omnitrans weekday ridership averaged 58,928 for the month. November seems to be keeping pace with over 65,000 passengers transported on the first day of the month.
“I believe our record ridership demonstrates that people are looking for economical and environmentally friendly transportation. When people try Omnitrans, they find out we offer great service—on time, friendly drivers, clean buses—and then they keep riding,” said Omnitrans CEO/General Manager Milo Victoria.
Route and schedule information is available online at www.omnitrans.org or by phone at 1-800-966-6428.
Top Five Ridership Months
| Month/Year | Fixed Route Ridership |
| October 2012 | 1,547,378 |
| October 2001 | 1,543,869 |
| October 2002 | 1,484,943 |
| October 2008 | 1,466,470 |
| August 2001 | 1,440,920 |
October Ridership 2008-2012
| Month/Year | Fixed Route Ridership |
| October 2012 | 1,547,378 |
| October 2011 | 1,414,348 |
| October 2010 | 1,268,644 |
| October 2009 | 1,315,612 |
| October 2008 | 1,466,470 |


